Discrete vs Continuous: What’s the Difference? becomes clearer when you look at how you create data through a text message, photo, Instagram post, or browsing across various websites.
This data creation produces generated data every day. In 2020, people generated 2.5 quintillions of data every second, showing how quickly numbers can grow.These data types include structured data, unstructured data, qualitative data, and quantitative data. Structured, unstructured, qualitative, and quantitative data describe information in different ways.
For businesses, understanding these types and their fundamentals supports better data working and decision-making.Discrete vs. continuous data becomes easier when you examine each number. Discrete data uses separate, countable values, while continuous data can cover a range, such as time or measurements.
These ways help you understand modern data and interpret information accurately.
Quick Answer:
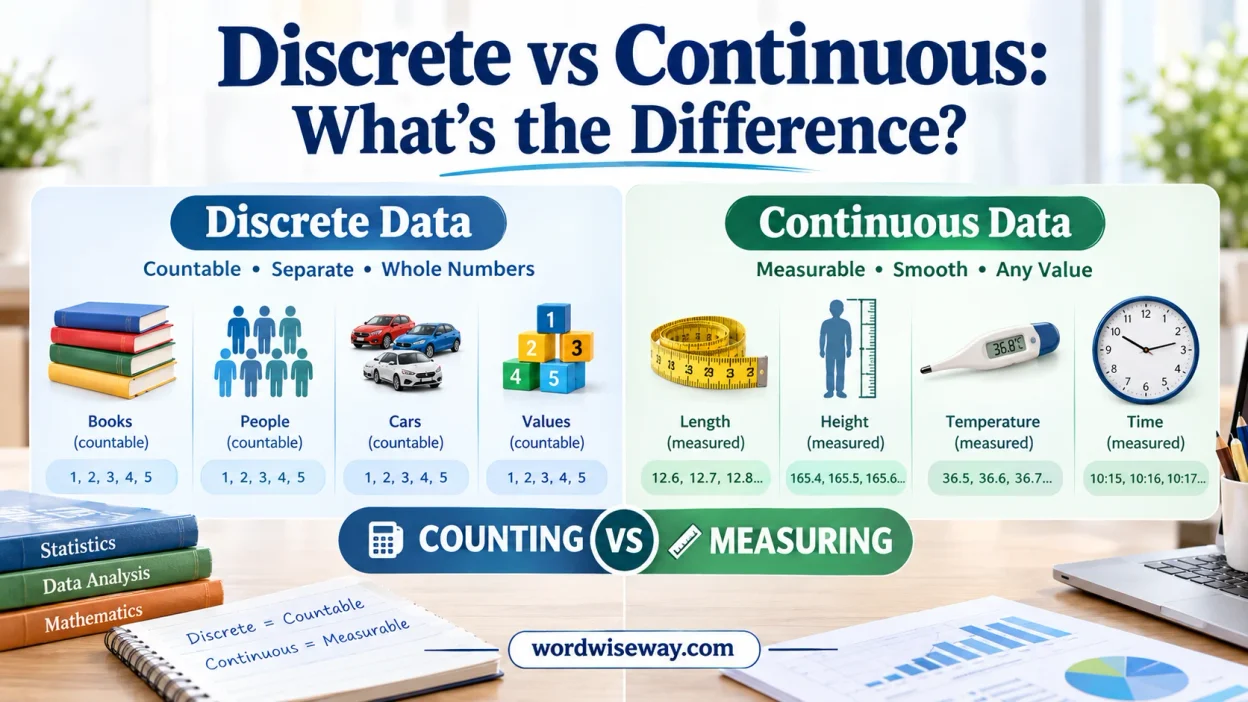
Discrete data consists of separate, countable values. You usually obtain it by counting individual objects, people, events, or occurrences. Examples include the number of students in a class, the number of cars in a parking lot, and the number of goals scored in a game.
Continuous data can take any value within a range. You usually obtain it by measuring something such as height, weight, temperature, distance, or time.
| Feature | Discrete Data | Continuous Data |
| Basic idea | Separate, countable values | Values measured along a range |
| Common source | Counting | Measuring |
| Intermediate values | Usually not possible | Usually possible |
| Possible values | Finite or countably infinite | Infinitely many within an interval |
| Example | Number of customers | Customer waiting time |
| Common decimals | Not a deciding factor | Common |
| Typical statistical model | Discrete probability distribution | Continuous probability distribution |
A useful starting rule is simple: if you count it, it tends to be discrete; if you measure it, it tends to be continuous. Still, you should check the underlying variable before making the final classification.
What Is Discrete Data?
Discrete data consists of distinct values that you can count individually. Each possible value stands apart from the next.
For example, suppose a store records the number of customers who enter each hour. The store might record:
- 18 customers
- 19 customers
- 20 customers
- 21 customers
It wouldn’t record 19.6 customers. The variable represents individual people, so its possible values are separate counts.
Discrete data often describes how many rather than how much.
Examples of Discrete Data
Common examples include:
- Number of students in a classroom
- Number of books on a shelf
- Number of employees in a company
- Number of cars in a parking lot
- Number of emails received
- Number of products sold
- Number of defective items
- Number of goals scored
- Number of website visits
- Number of children in a family
Each value represents a count of distinct units or events.
Why Is Discrete Data Countable?
The key feature isn’t simply that discrete values look like whole numbers. The deeper point is that you can identify individual outcomes.
Suppose a factory produces 10 defective products in one day. The number of defective products is a count. You can increase that number from 10 to 11 by adding one more defective product.
There is no meaningful state between 10 and 11 defective products.
That gap is what makes the variable discrete.
Can Discrete Data Have Decimals?
Yes, in some situations, discrete data can involve decimal notation. The presence of a decimal point doesn’t automatically make a variable continuous.
The important question is what the values represent.
For example, imagine a system that records a rating using fixed increments:
- 0.0
- 0.5
- 1.0
- 1.5
- 2.0
If those are the only permitted values, the variable is discrete because the possible outcomes are separated.
Likewise, a variable could theoretically have values such as 1.25, 1.50, and 1.75 while remaining discrete if the system only permits those specific values.
So don’t use this shortcut:
“Decimal = continuous.”
Instead, ask whether values between the recorded points are possible within the variable’s definition.
What Is Continuous Data?
Continuous data can take any value within a particular interval. You normally obtain continuous data through measurement.
Imagine measuring the length of a table. You might record:
- 120 cm
- 120.5 cm
- 120.52 cm
- 120.527 cm
With sufficiently precise equipment, you can continue recording smaller differences.
The number of possible values between two measurements can become extraordinarily large. That’s the defining feature of continuous data.
Examples of Continuous Data
Common examples include:
- Height
- Weight
- Temperature
- Distance
- Time
- Speed
- Length
- Width
- Volume
- Pressure
- Mass
These quantities don’t naturally jump from one value to another in the way counts do.
Why Is Continuous Data Measured?
Continuous variables describe quantities that can vary along a scale.
Suppose a runner completes a race in 12.4 seconds. Better timing equipment might record 12.43 seconds. Even more precise equipment could record 12.431 seconds.
The underlying quantity doesn’t suddenly become discrete because a stopwatch displays only two decimal places.
The recorded value reflects measurement precision, while the underlying variable can remain continuous.
The Key Differences
The difference between discrete and continuous data becomes clearer when you examine several characteristics.
Counting vs Measuring
The most useful first distinction involves how you obtain the data.
Discrete variables are commonly counted. Continuous variables are commonly measured.
For example:
- Number of students = counting
- Number of cars = counting
- Height of students = measuring
- Temperature of a room = measuring
This distinction works for many everyday situations.
Separate Values vs Values Along a Range
Discrete variables contain distinct possible outcomes.
If a restaurant has 50 customers, the next possible count is 51. You don’t normally have 50.3 customers.
Continuous variables behave differently. Between 50.0 and 51.0 kilograms, countless measurements can exist.
You could have 50.1 kg, 50.01 kg, 50.001 kg, and so forth.
Finite and Infinite Possibilities
A discrete variable can have a finite number of possible values or a countably infinite number.
For example, the number of students in a particular classroom has a practical upper limit. Meanwhile, the number of times an event could occur may theoretically continue without a fixed upper boundary.
A continuous variable has infinitely many possible values within an interval. These values aren’t merely numerous. They form a continuum.
Decimal Values Aren’t the Main Test
This point causes frequent confusion.
A measurement such as 5.72 meters strongly suggests continuous data. However, the decimal itself isn’t what makes it continuous.
Similarly, whole-number data can represent a continuous quantity if measurement and rounding produced those displayed values.
For instance, someone’s recorded temperature might appear as 37°C because the thermometer rounds to the nearest whole degree. Temperature itself remains a continuous quantity.
Examples
The following table shows how the distinction works in practical situations.
| Variable | Type | Reason |
| Number of students | Discrete | Students are counted |
| Student height | Continuous | Height is measured |
| Number of cars | Discrete | Cars are counted |
| Car speed | Continuous | Speed is measured |
| Number of emails | Discrete | Emails are counted |
| Email response time | Continuous | Time is measured |
| Number of employees | Discrete | Employees are counted |
| Employee weight | Continuous | Weight is measured |
| Number of accidents | Discrete | Accidents are counted |
| Distance traveled | Continuous | Distance is measured |
| Number of products sold | Discrete | Products are counted |
| Product weight | Continuous | Weight is measured |
This comparison reveals a useful pattern. Two variables from the same situation can belong to completely different categories.
A delivery company might track the number of packages delivered, which is discrete. It might also track delivery time, which is continuous.
The context doesn’t determine the classification. The variable does.
How to Tell If Data Is Discrete or Continuous
When you’re unsure, use a short decision process.
Ask Whether You’re Counting or Measuring
Start with the simplest question:
Are you counting individual units or measuring a quantity?
If you’re counting people, objects, events, or occurrences, the variable will usually be discrete.
If you’re measuring length, mass, time, temperature, or another physical quantity, it will usually be continuous.
Ask Whether Values Between Two Numbers Make Sense
Suppose a dataset contains 5 and 6 as possible values.
Ask whether 5.5 makes sense for that variable.
If you’re counting children, it doesn’t.
If you’re measuring weight, it does.
This test often exposes the difference quickly.
Examine What the Variable Represents
Don’t classify a variable based solely on how its values appear.
Consider age. A person might report their age as 17 years, but their actual age changes continuously with time. Depending on the statistical context, age can therefore be treated as a continuous variable when measured precisely.
Now consider number of birthdays celebrated. That’s a count and therefore discrete.
The wording and measurement method matter.
Check the Possible Values
Finally, examine the set of values the variable can take.
If the possible outcomes are distinct and separated, you’re dealing with discrete data.
If any value within a meaningful interval can occur, you’re dealing with continuous data.
Discrete vs Continuous in Statistics
The distinction becomes especially important in statistics because discrete and continuous random variables use different probability frameworks.
A random variable assigns numerical values to outcomes of a random process.
Discrete Random Variables
A discrete random variable has separate possible values.
For example, let X represent the number of defective products in a batch.
Possible values might include:
- 0
- 1
- 2
- 3
- 4
You can assign a probability to each individual outcome.
For example:
P(X = 2) means the probability that exactly two defective products occur.
This makes probability tables particularly useful for discrete variables.
Continuous Random Variables
A continuous random variable can take any value within an interval.
Suppose X represents the waiting time for a customer.
The value could be 3.2 minutes, 3.21 minutes, 3.214 minutes, or another value within the relevant range.
For continuous variables, probability is generally calculated over intervals.
For example:
P(3 < X < 5) represents the probability that the waiting time falls between three and five minutes.
Probability Mass Functions vs Probability Density Functions
Statistics uses different mathematical tools for these two types of random variables.
A probability mass function (PMF) describes probabilities for discrete outcomes.
A probability density function (PDF) describes the distribution of a continuous random variable.
One important detail often surprises beginners: for a continuous random variable, the probability of one exact point is typically zero.
That doesn’t mean the value cannot occur. It means a single exact point has no measurable width within the continuous range.
Discrete vs Continuous Graphs
The type of data also affects how you visualize it.
Graphs for Discrete Data
Discrete data often works well with bar charts.
For example, a bar chart could display the number of customers who visited a store on different days.
Each value remains distinct, so separate bars clearly represent the categories or counts.
Graphs for Continuous Data
Continuous data commonly appears in histograms, density curves, and other graphs that represent values across intervals.
Suppose you measure the heights of 1,000 students. A histogram can group those measurements into ranges such as:
- 140–149 cm
- 150–159 cm
- 160–169 cm
- 170–179 cm
- 180–189 cm
The measurements occupy a continuous scale even though the graph groups them into intervals.
Why Visualization Matters
A suitable graph makes the structure of your data easier to recognize.
A bar chart emphasizes separate categories or values. A histogram emphasizes the distribution of measurements across a numerical range.
Choosing the wrong visual can make correct data look confusing.
Discrete vs Continuous in Real Life
The distinction appears almost everywhere data is collected.
Education
Schools might record:
- Number of students enrolled = discrete
- Number of classes = discrete
- Student height = continuous
- Test completion time = continuous
- Student weight = continuous
A school dataset can contain both types simultaneously.
Business
Businesses regularly collect both discrete and continuous data.
Examples include:
- Number of customers = discrete
- Number of purchases = discrete
- Revenue = often treated as continuous for statistical modeling
- Delivery time = continuous
- Product weight = continuous
The classification depends on the variable’s mathematical treatment and measurement process.
Science
Scientific research relies heavily on continuous measurements.
Scientists may measure:
- Temperature
- Mass
- Distance
- Pressure
- Time
- Volume
They also collect discrete counts, such as:
- Number of samples
- Number of organisms
- Number of experimental events
- Number of observed mutations
A single scientific study can therefore involve both data types.
Technology and Data Analysis
Technology produces enormous amounts of both discrete and continuous information.
For example, an application might record:
- Number of users = discrete
- Number of clicks = discrete
- Page-loading time = continuous
- Network latency = continuous
- Download speed = continuous
Understanding the difference helps analysts select suitable statistical methods and visualizations.
Tricky Examples
Some variables deserve extra attention because their classification isn’t immediately obvious.
Number of Customers vs Customer Waiting Time
A store might record the number of customers served each hour.
That variable is discrete because customers are counted.
The same store might record how long each customer waits.
That variable is continuous because waiting time can be measured with increasing precision.
Number of Cars vs Car Speed
The number of cars in a parking lot is discrete.
A car’s speed is continuous.
Even if a dashboard displays speed as 60 mph, the underlying speed can change through many intermediate values.
Number of Defective Products vs Defect Size
The number of defective products is discrete.
The size of a defect can be continuous because it can be measured with different levels of precision.
This example shows why the property being measured matters more than the object itself.
Discrete vs Continuous Data in a Dataset
A real dataset can contain both types of variables.
Consider this simplified delivery dataset:
| Variable | Example Values | Type |
| Number of items | 2, 5, 8 | Discrete |
| Delivery time | 32.4, 41.8 minutes | Continuous |
| Number of orders | 12, 15, 18 | Discrete |
| Package weight | 1.25, 2.75 kg | Continuous |
| Number of delivery attempts | 1, 2, 3 | Discrete |
Notice how the variables don’t all behave alike.
Number of items can only take separate counts. Package weight can vary along a measurement scale.
This distinction becomes important when building statistical models, calculating probabilities, and selecting visualizations.
Common Mistakes
Several misconceptions repeatedly trip up students.
“All Numbers With Decimals Are Continuous”
Not necessarily.
A decimal value can still belong to a discrete set if the variable permits only specific outcomes.
Always examine the possible values rather than the decimal point.
“Continuous Data Must Have Decimals”
Not true.
A continuous quantity can be rounded and recorded as a whole number.
For example, a temperature reading might be rounded to 20°C. The underlying temperature doesn’t suddenly become discrete.
“Time Is Discrete Because Clocks Show Seconds”
The display isn’t the same as the underlying quantity.
A digital clock might show whole seconds, yet elapsed time can be measured with much greater precision.
Therefore, time is generally treated as continuous in statistical analysis.
“A Variable With Many Values Is Continuous”
A large number of possible values doesn’t automatically make a variable continuous.
A discrete variable can have many possible outcomes while still consisting of distinct, countable values.
The crucial question is whether intermediate values can exist.
Discrete vs Continuous vs Categorical Data
Discrete and continuous data belong to the broader world of quantitative numerical data.
Categorical data works differently.
Consider these three examples:
- Number of siblings = discrete numerical
- Height = continuous numerical
- Eye color = categorical
Number of siblings represents a count.
Height represents a measurable quantity.
Eye color represents categories rather than numerical amounts.
This distinction matters because categorical variables require different methods of analysis and visualization.
A Practical Case Study
Imagine a hospital tracking emergency-room activity.
The hospital records:
- Number of patients arriving = discrete
- Patient age = commonly treated as continuous when measured precisely
- Body temperature = continuous
- Number of patients admitted = discrete
- Waiting time = continuous
- Number of available beds = discrete
Now imagine analyzing this dataset.
A statistician might use count-based probability models for the number of arrivals. They could use continuous probability distributions to model waiting times.
The same hospital can therefore produce both discrete and continuous variables from the same daily operation.
That distinction isn’t merely academic. It affects how the data should be modeled.
Why the Discrete vs Continuous Difference Matters
Correctly identifying your data type helps you make better analytical decisions.
It can affect:
- Statistical models
- Probability calculations
- Data visualization
- Sampling methods
- Distribution selection
- Interpretation of results
- Machine learning preprocessing
- Descriptive statistics
For example, treating a count variable as though it were a continuous measurement can lead to an unsuitable statistical approach.
Likewise, treating a continuous measurement as a simple set of categories can throw away useful information.
The classification step may look small, but it can shape the entire analysis.
Quick Revision
| Question | Discrete | Continuous |
| What does it usually represent? | A count | A measurement |
| Can you count individual outcomes? | Yes | No |
| Can values exist between two points? | Usually no | Yes |
| Are decimals possible? | Sometimes | Commonly |
| Does rounding change its underlying type? | No | No |
| Example | Number of books | Book weight |
| Common graph | Bar chart | Histogram or density curve |
| Probability approach | Individual outcomes | Intervals and areas |
The fastest reliable method is to ask:
What does this variable represent, and what values can it actually take?
If it represents separate countable outcomes, it’s likely discrete. If it represents a measurable quantity that can vary across a range, it’s likely continuous.
Read More: Successfully or Successfuly: Which Spelling Is Correct?
FAQs
1. What does discrete data mean?
Discrete data contains separate values that you can count. Examples include the number of students, messages, products, or website visitors. You normally represent this data with whole numbers.
2. What does continuous data mean?
Continuous data can take any value within a specific range. Measurements such as height, temperature, distance, and time are common examples. Decimal values can appear because the measurement can become increasingly precise.
3. What is the main difference between discrete and continuous data?
The main difference is how values occur. Discrete data has distinct, countable values, while continuous data can have countless possible values within a range.
4. Is the number of people discrete or continuous?
The number of people is discrete because you count individual people. You can have 20 or 21 people, but you can’t normally have 20.5 people in a count.
5. Is time discrete or continuous data?
Time is generally considered continuous because it can be measured at increasingly precise points. For example, you can measure hours, minutes, seconds, and smaller intervals.
6. Is temperature discrete or continuous?
Temperature is continuous data because it can take decimal values within a range. A temperature might be 25°C, 25.5°C, or 25.53°C depending on measurement precision.
7. Are discrete and continuous types of quantitative data?
Yes. Both discrete and continuous data are forms of quantitative data because they involve numerical values. The difference lies in whether those values are countable or measurable.
8. Why does the difference matter in statistics?
The distinction helps you choose suitable methods for organizing, analyzing, and displaying information. Different data types can require different statistical approaches.
9. Can data be both discrete and continuous?
A dataset can contain both types, but an individual variable is usually classified as either discrete or continuous. For example, a study might record both the number of participants and their heights.
10. How can I identify discrete or continuous data?
Ask whether you are counting or measuring. If you count separate items, the data is usually discrete. If you measure something that can take values across a range, it is generally continuous.
Conclusion
Understanding discrete and continuous data gives you a clearer way to classify numerical information. Discrete data focuses on separate, countable values, while continuous data describes measurements that can fall anywhere within a range. This simple distinction appears in everyday examples, from counting website visitors to measuring time or temperature.
Once you recognize how each type behaves, data analysis becomes easier to understand. You can identify whether a value represents a count or a measurement before choosing how to organize it. This approach also helps you communicate numerical information more accurately, especially when working with statistics, research, or business data.
The key is to remember one practical question: Are you counting something or measuring it? Counting usually points toward discrete data, while measuring usually points toward continuous data. With that distinction in mind, you can approach different datasets with much greater confidence.

Evelyn Shaw has spent 14 years at Yale University’s English Department, leading students through close readings, genre studies, and interpretive methodologies. Her scholarly interests include Renaissance drama, gothic fiction, feminist literary criticism, and archival research and examining how texts generate meaning across historical periods. Evelyn has presented at major academic conferences and published essays in peer-reviewed journals, reflecting her passion for rigorous analysis and student-centered learning.